
Click for PDF
Early Modern Studies Journal
English Department | University of Texas | Arlington
Sifting and Sorting: An Introduction to Database Methods and Pedagogy using Humanist Texts
Danielle Rosvally, University at Buffalo
Introduction and Methods
The problem of data in the humanities is one that we, as a field, are only just beginning to explicate. What is “data” to a humanist, and how can it be gathered, interpreted, and used in scholarship? In her useful basic treatise on digital scholarship, Christine Borgman recognizes what she calls a “widely accepted” definition of data: “a reinterpretable representation of information in a formalized manner suitable for communication, interpretation, or processing.”[1] Borgman’s definition highlights that “data” is a function of form, not content; it’s not what something is but how that thing is presented which creates data. Incorporating data in humanist research is, thereby, a matter of reframing critical thought. The question becomes not what is data, but how can we create data from humanist objects? In exploring this question, the Baumfylde manuscript provides a unique opportunity as a case study for data creation in the humanities.[2] The Baumfylde manuscript is a collection of recipes held by the Folger Shakespeare Library, written on seventy-six leaves in several different hands. Inscribed “Mary Baumfylde her booke June Anno 1626,” it includes medicinal recipes as well as receipts for food, preserves (that is, food not for immediate consumption), and drink.[3] The manuscript creates many spaces for what I will call “data translation” (i.e. “translating” an object into usable data), and the formulaic nature of the manuscript makes it a friendly resource for training humanists of any scholarly level (from undergraduate through professionals) to engage with data in a meaningful way.[4]
The usefulness of quantitative analysis of recipe books is well explored by Gilly Lehmann.[5] Lehmann focuses on ingredients, and uses analysis of these ingredients to pinpoint changes in spice preference and cooking styles over the course of the medieval period (1580 – 1659).[6] Work like Lehmann’s demonstrates how data-driven study can be the central focus of humanist inquiry and can create a backbone for further work. Other major Digital Humanities (or “DH”) projects such as Six Degrees of Francis Bacon, the World Shakespeare Bibliography, and Open Source Shakespeare show the many forms databases can take on the front end (from Graphical User Interfaces, or GUIs, like Six Degrees to more traditional “database” interfaces like WSB).[7] All of these projects are dependent on data as input, and release data as output in some way.
The above-mentioned projects, notably, are massive and technically elegant. This is essentially due to a general truism about quantitative analysis: larger and broader data will yield more robust results. But projects as deep and broad as Lehmann’s or Six Degrees can be difficult for beginners to conceptualize. As entry points into the potential for Digital Humanities and data, they are exemplar. As entry points into the process of creation for similar projects, they can be intimidating. The Baumfylde manuscript creates an excellent gateway to the underlying methods and structures required for digital thought. By conceptualizing individual instances of data (in this case, a single volume of recipes), students can better start to understand how larger Digital Humanities projects might come together.
When I encountered the Baumfylde manuscript, I was drawn to these opportunities as a means of engaging with the text. Rather than a traditional argumentative academic essay, what follows here is an exploration of how this manuscript can be used to unlock basic structures of data study for beginners. In Appendix I, I will provide a series of teaching activities which take novice users through the process of database creation, step by step, and are designed for a classroom setting (though certainly could be appropriated as individual exercises). It is my hope that this explanation and accompanying materials can prove useful as a teaching tool, or as a guide for furthering self-education and inquisitiveness around data and (specifically) humanist data.
I have tried to make my exploration as beginner friendly as possible. Because of this, I have opted to use an Excel database as a means of explicating process. Text encoding accomplished through TEI-XML markup would be a more field-standard practice, but it also creates a barrier for entry. Such markup requires specialized software (readily and freely available, but not necessarily user friendly to those who have never coded before), as well as knowledge of coding structures and basic coding language. Additionally, the end goal of text-encoding projects is often to create, from the textual encoding, a database.[8] Because this essay will explore digital methods at the entry level, I have opted to discuss creation of the database itself rather than a coded edition of the text. This allows users to generate data using an interface that most of them will be familiar with, and also bypasses the step of moving an encoded edition from raw TEI-XML (or similar) to a database. Additionally, a fundamental understanding of database structure and creation is a necessary precursor to coding the transition from encoded textual edition to database, so this knowledge is an important first step towards conceiving of and creating more complex projects.
Many users know some things about Excel but few have exhaustive experience with this program. Excel, then, serves this project as a platform for jumping off and welcoming the sort of inquiry that is standard practice in the Digital Humanities: self-teaching, via web interfaces, about elements of a tool one does not yet claim expert knowledge over. For instance: an Excel database includes a column with recipe names, but I want to create a column with those names properly capitalized. I could do it by hand, of course, but that process is time-consuming; can I use Excel to code that?[9] Encouraging this type of question-asking – trusting that the tool is capable of automating tasks, and subsequent discovery of how it does so – will encourage confidence in digital capabilities and the use thereof. Because I am looking to engage entry-level users, complex terms and concepts are often simplified below. It is my hope that this will help to unlock data studies for those who have, perhaps, wished to incorporate it into their scholarship but were not sure where to start, and that this non-standard use of a standard interface can serve as a friendly introduction to basic concepts of digital work.
Recipe books lend themselves particularly well to this type of work. They are, by their nature, experiential; they document experience so others may repeat the experience to similar ends. Susan Leonardi calls recipes “embedded discourse,” underlying the notion that recipes are the middle, not the end, of a conversation.[10] In many cases, the teaching of early modern recipe culture echoes this claim: from the Early Modern Recipe Collective’s “feminist research methods” and communal techniques such as their transcribathons described by Rebecca Laroche et al., to the online collaborative research hub The Recipes Project, recipe research (especially in the digital sphere) proves to be highly collaborative.[11] Pedagogy engaged with it (highlighted in both Laroche et al. as well as the pedagogical series on The Recipes Project) is open-source in nature, not just technologically but also in terms of conversations which stem from ongoing research.[12] In dialogue with the methods discussed by Laroche et al., this essay outlines a step by step means for scaffolding digital thinking in a collaborative classroom environment, accessibly highlighting learning opportunities in the Baumfylde and other manuscripts. While the process I describe here does create a product (and I’m attaching that product – the database I created – as an example of something that can be made from this work), I invite the reader to consider the outlined process as more important. As an artifact of pedagogy, the making of this rudimentary database is the method of instruction rather than the thing it creates.
Step One: Projecting to the Finish by Imagining the Digital Object
The first step towards crafting a usable dataset from a humanist object is to envision, in some way, scale and scope. Every object might contain infinite combinations of potential data, and crafting an all-encompassing database (while perhaps the ultimate goal of a project) can be overwhelming. In order to conceive of how to order or structure their data, one must first have some idea of what one is measuring or tracking.
In many ways, this is like writing the abstract of a paper before writing the paper itself. While researchers might have some sense of what they hope to create, the full details have yet to unfold. Still, one must be able to envision the finished product in order to describe it. The most important concept this description will unlock is data structure – what will be collected? How? How will it be displayed and stored? In the case of the Baumfylde collection, structure is largely encoded in the manuscript. Recipes have definite and discrete parts: ingredients, methods, measurements, etc. Because the manuscript’s recipes are crafted as how-to guides for creating something in real time within the confines of an early modern kitchen, these parts are always present (at least to some degree) in each Baumfylde recipe. As a result, a recipe book is a data curator’s dream. The manuscript has already done much of the work of breaking its data into parts, all I had to do as an interpreter was listen to what had already been created.
The recipe book as an artifact presents a tension between form and function – the act of reading, and the act of making.[13] Elizabeth Spiller argues that the seventeenth-century recipe book is an artifact of a cultural shift in the idea of what “experience” is – moving from an Aristotelian definition involving truth as a generality, to an early modern definition involving an experience as a singular, repeatable act following definite and determined physical laws. Recipe books, then, represent a movement from “art and mystery” to “experience and experiment.”[14] The epistemological shift from recipe book to database is not unlike the epistemological shift from doing to knowing inherent in the creation of a recipe book itself.[15] As a means of knowledge production, the construction of a database from a recipe book continues the process of writing down knowledge that the original recipe writers began.[16] This shift changes the way information is presented, but the change is made explicitly to highlight information that would otherwise be obscured. Further, the process of making a database engages with the knowledge on the page in a way that allows students to become part of that knowledge. Pamela Smith proposes that reading alone is not sufficient to engage with the text of how-to books (specifically early modern experiential guides).[17] Elizabeth Spiller further argues: “it may be that the only way to read a cookbook is to bring it into the kitchen.”[18] I postulate that the data translation process is an act of doing that can engage a learner with the text in a similar fashion to the acts of creation which guide Smith’s study, and which prompt Spiller’s argument.
The first step of translation is structure, and Teaching Activity 1 (found in Appendix I) will guide students towards the bones of their projects. As a demonstration of latent data structure, I have compiled Figure A, a graphic representation of categories which I see represented on a discreet page of the manuscript. I’ve taken Baumfylde folio 6 verso/folio 7 recto and used color-coded annotation to break the recipe down into the following parts: Recipe Title (purple), Ingredients (red), Preparation Techniques (blue), Quantities (green), and Time Measurements (pink).

[Figure A]
In looking at Figure A, the sheer amount of data contained in the manuscript begins to become evident. This one discrete recipe on a single page of Baumfylde’s 76 folios yields five loose data “types” (represented by the different annotation colors), with each type occurring in between one and eleven instances on this single page.[19]
Despite this, the Baumfylde manuscript (and any data mined from it) is not truly “big data” by anyone’s definition. It is a single manuscript, and while it has what Alan Liu would call “facets” (different types of things which might later prove useful as searchable items i.e.: ingredients, cook times, techniques, etc.), it’s not exhaustive.[20] It is but one volume in a field of many – exactly how many would depend on what a researcher looks to compare it with (early modern recipe books, manuscripts from a certain timespan, manuscripts written and compiled by women, handwritten manuscripts in the English language, etc.). Any one of these categories might represent a much more robust data pool than a single volume and would allow more specific queries and generalizations to be made.[21] Still, the Baumfylde manuscript on its own is significant as a source – it’s simply important to define the scale of this source in order to define the scale of potential inquiry which mining it represents. One can feasibly and reliably answer different questions with one book just as one can with ten. This is as important to remember at the brainstorming stage of a project as it is at the data analysis stage – in examining one instance of a (potentially) large field, findings should be thus qualified.
In discussing Teaching Activity 1, several important conversations can already be had. Among them: what constitutes a “category”? What types of information should be grouped together, and how? What should these categories be called? Though I have found five categories on the example page and given these categories names which make sense to me, those labels and titles might not be intuitive to all users of this data set. How can data labels be simultaneously pithy and descriptive so that the data produced from translation is useful to others?
The very concept of defining data “categories” can be problematic for many reasons, but perhaps the broadest is the sense that it imposes outside structure on a document that wasn’t meant to be taken apart in this fashion. While some parts of a recipe book (like ingredients) lend themselves nearly seamlessly to data categorization (an ingredient is generally easily defined by category boundaries with few fringe cases to consider), this is fairly unique in the translation process. The boundaries of categorization should be seen much like idioms in literal translation: though a representation of them can be made with enough care and creative intent, it is possible to lose nuance en route to the finished product. This complication should serve as a beginning, not an end. It should provoke critical thought and conversation, and encourage deep discussions of the work at hand rather than stand as reason not to engage in database analysis.
One excellent method of conceiving of appropriate categories is to turn to extant projects – and there are several large recipe-focused ones available for study. One such project is The Colour ConText database.[22] This massive effort looks to explore the use of recipes in the context of artisanal workshops. To date, over 500 manuscripts and 6,500 discrete recipes have been entered into the Colour ConText database, and the database itself serves as the basis for several other DH projects (including ARTECHNE, a project aimed at identifying the transmission of “technique” among artists).[23] Colour ConText’s categories include manuscript author, language, library, year, artistic contents, artistic techniques, and a tag for other contents. The database also allows keyword searching, which implies that there is some back-end infrastructure to support keywords. Looking at these categories and considering the function that Colour ConText was built to perform, the categories support the work. Artistic information pairs with geo-location data (such as original language and library of origin) as well as recipe metadata (such as year authored) to provide a robust data point indicating context of artistic knowledge. ARTECHNE has similar fields, but adds a “content type” field which offers several new options including artefact [sic], current name, historical name, person, reconstruction, etc. Since ARTECHNE is primarily concerned with transmission of knowledge, these new tags increase the specificity of metadata, and allow trends related to the physical tasks of creation to become apparent in the analysis phase.
Categories are necessary to digital work. While arguments could be made for or against the use of any category label conceived of within a given project, this complication pinpoints precisely why defining boundaries of categories is a useful exercise in knowledge production – especially for students.[24] Returning to the Baumfylde (and Figure A), the problem of category boundaries comes into focus. For instance: looking at the last few lines of this recipe, the maker is instructed to let the mixture “stand till it be cold.” Is “stand” a preparation technique? I have counted it as such. Similarly, on the next line, the preparer is reminded to “lay” their ingredient “in clean water 1 hower or 2…”. Is “lay” a preparation technique? I have also counted it as such, but perhaps it shouldn’t be. How about “take” or “put”? What if I called the category “Preparation Methods”? Would “stand,” “lay,” “take,” and/or “put” belong in the grouping then? Which version will capture the most data, or the cleanest data, or the best data? The answer to this last questions will depend upon the project driving data collection, and should be discussed in further depth in Teaching Activity 2.
Another set of details that must be discussed early in a DH project’s conception is the granularity with which ingredients will be captured – in the example above, should “water” be noted or “clean water”? Are they different?[25] These two examples are different facets of a larger problem: humanist texts can be translated into data, but they are not data in and of themselves. As with any translation, nuance can often be lost. Whether an individual nuance is important is left to the translator to decide – and in Digital Humanities projects, that often is reliant upon the questions being asked. For my purposes, since I wasn’t tracking preparation techniques, the question regarding “stand” and “lay” is a useful case study for someone else. In tackling the second question regarding “water” and “clean water” (since I was tracking ingredients): I allowed these items to remain as granular as possible (for now, at least).
These questions try boundaries of critical thinking and push up against ideas about how knowledge is assembled and created. For students, it allows them to dig into what they know, how they know it, and how an impression is proven. What creates conclusions? What information does someone need to have in order to “know” something? Meta-analysis of their own assumptions allows students to question “common” knowledge and rigorously exercise critical thinking skills. The student thus becomes an agent of knowledge creation, rather than a recipient of it, and learns to test hypotheses against the rigors of primary source documentation.
Database work teaches categorical thought because it requires students to break their questions down into basic parts. In order to answer anything using a database, the students have to get their hands dirty in the manuscript. Additionally, they have to figure out what can answer their question. What do they need? How can they get what they need out of a manuscript? Is it even possible to get what they need, or is there a piece missing to make the conclusion stick?
Another issue that should be considered in this step is that of transcription. Transcription raises two troubles in data collection, but both are connected to the greater issue of clarity. While much of the Baumfylde manuscript is written in a clear hand, there will be the occasional word that even professional transcribers disagree upon. How should those words be placed into a dataset? Knowing that computers make their best matches using exact words, there is the potential for data loss as transcribers struggle to make sense of the manuscript.[26] Additionally, should spellings be preserved as they are in the Baumfylde, or standardized? This issue touches upon data “cleanliness” – a “clean” dataset is well standardized, smartly catalogued, and (essentially) ready for analysis.[27] In many ways, staying steadfastly and rigidly true to the manuscript will not create a dataset clean enough for easy ingestion and analysis, but where does a researcher draw the line? This is an issue I will discuss below, but the sooner the researcher begins to consider it the better. It is much easier and less time-consuming to enter data according to pre-determined rules during harvesting than it is to revise these rules during data cleaning. As such, handling transcription should be an important part of discussion during Teaching Activity 2.[28]
Step Two: Considering Data Structure
With the questions and complications outlined above in mind, I set about creating a preliminary database using Baumfylde’s text. Knowing that I could not track every potential variable, at least on my first pass, I settled on crafting a resource which catalogued the use of ingredients in the manuscript. My initial idea was to determine which ingredients were most common, and from there to hypothesize what ingredients an early modern recipe preparer might have been expected to keep on hand in order to use a recipe book and how (or if) this might differ depending on the use intention of the finished products. As I began to sort through the manuscript, I realized that I would also want to tag and label the recipes themselves. Because I was thinking about the product of these recipes, a “recipe type” field became the obvious choice to delineate the purpose of each finished recipe – that is, the creation of a food the be immediately eaten, a preserve, or a medicine.
I want to highlight a few vocabulary words that are important in considering data structure, at least in this rudimentary form: Metadata is most easily conceived of as “data about data.” Metadata is used to describe what kind of information is being detected, and is helpful in tracking large trends in a manuscript. A Field is the place where single pieces of data go; think of this as a cell in a spreadsheet. There are several types of fields, but for the purposes of this project I will only distinguish two of them. An Open Field is a field that allows any information, a field where users can type whatever they want. A Controlled Field is a field where the input is limited to a certain pre-defined list of possible entries; think of this as a field with drop-down options rather than open text.
I settled on the following fields for my database:
The “where” fields: these two fields help to identify where each ingredient was written and, therefore, where a user might find it mentioned:
- Folio Number: A field to document what number folio the recipe was written upon. Entry to this field will be numeric.
- Side: A field to document if the recipe was written on the recto or verso side of the folio. This will be a controlled field.
The “what” fields: these two fields identify each specific ingredient and the names of the recipes in which they were found:
- Recipe Name: The title of the recipe in which a given instance of the ingredient was contained.
- Ingredient: The name of the ingredient.
The “metadata” fields: these two fields help to compile metadata about either the recipe, or the page upon which it is written:
- No Recipe: a field to mark blank pages so as to make the database complete and inclusive. This field will be boolean; either marked with an “x” to denote true or nothing to denote false.[29]
- Recipe Type: A field to document what type of recipe the ingredient was found in. This will be a controlled field with the following options: “Medicinal,” “Food,” or “Preservation.”
As discussed above, I used Microsoft Excel to create the preliminary database, though I later moved it to Google Sheets for ease of sharing the information. Both programs have very similar functions, and since this database wasn’t going to be large (at least, as far as databases go) I knew I wouldn’t run into issues saving it to either source.
The best data is the needed data. Data collection is time consuming, and it does not make sense to put hours into harvesting and cleaning a dataset that can only be used by one person or project. That said, there’s a limit to what one researcher can do in one pass. Granularity of data – that is, the degree of specificity one can reach when assigning categories – will determine the usefulness of a dataset to a wide audience. For instance: instead of saying “recipe” to describe all of the recipes in the Baumfylde manuscript, one might say “medicinal recipe” or “food item recipe” to delineate differences between them. One might, perhaps, further specify “food item” to be a “drink,” “dessert,” or “main course.” For perhaps a more intuitive representation of data granularity, see Figure B.[30]

[Figure B]
Granularity is flexible, and in large part can be guided by the purposes of a project with one important caveat: more granular data tends to be more useful at the analysis stage. It allows researchers to ask different questions of data than, perhaps, they had initially set out to answer. Take, for instance, the categories of different levels of granularity depicted in Figure B. Were I to code Baumfylde to this level of granularity and find that half of the manuscript’s recipes were food items, I could then also ask “what type of food items are most prevalent in this text?” I could also ask “what was the relative popularity of seafood in relation to other types of meat used in Baumfylde?” Were I only to code to Level 3 granularity, answering the second question would not be possible. Granularity comes with a price: there is a direct proportion between granularity and time – more granular data is more time consuming to harvest, so the translator must weight their needs, and the needs of potential end users, with allotted time.
Step Three: Harvesting and Cleaning Data
Now come the most time-consuming tasks of a data-driven project. With structure in place, the next step is to populate the dataset. As mentioned, I harvested the Baumfylde data by hand – which meant I went through each page of the manuscript and entered the information I gathered into my database without the use of a scripting tool or external program.[31]
While time consuming, the process of data harvesting is pedagogical in nature. Examining the data this closely allows researchers the opportunity to get to know it intimately. Not only does this knowledge push the researcher towards further questions, but it also challenges the boundaries of limits previously set in conversations about data structure. For instance: with my focus primarily narrowed on ingredients in the Baumfylde pages, I quickly discovered the complication of ingredient form. Some ingredients are mentioned in their raw form, some in a prepared form. Are “blanched almonds” the same as “almonds,” for example? “Lemon peel” the same as “lemon”? “Civil oranges” just “oranges”? Additionally, since I am not an expert in early modern cooking, it is highly likely that some ingredients have multiple common parlances which, in my database, have been labeled separately.
It is for this reason specifically (i.e. my lack of expertise in early modern cookery) that Tracey Berg-Fulton et. al have proposed that Digital Humanities projects should be conceived of as group endeavors with several definite roles: a “Humanist” to serve as subject expert, a “Technologist” to serve as expert for technology and technological purposes, a “Data Steward” to help shepherd the data from object to digital form, and a “Catalyst” to essentially work as a project manager and ensure that the entire group communicates clearly and effectively.[32] While Berg-Fulton et. al do specify that one team member might play several of these roles, it is generally not advisable for a single jack-of-all trades to take on every one of them. As such, my experimentations with the Baumfylde manuscript (in which I served as Humanist, Technologist, Data Steward, and Catalyst) cannot be said to be the best incarnation of itself. A dedicated and expert early modernist with a particular interest in food, for instance, would be able to either outright answer my above question about “oranges” and “civil oranges” or give enough contextual information that answering the query could be made more straightforward. A dedicated and expert computer programmer might take my database and build it a crowd sourcing platform so that others could add to it in one clean interface. Digital humanities projects are, at minimum, a sum of their assembled parts. In thinking about these parts (as students will be asked to do in Teaching Activity 4), it becomes clear that strong teams are crucial to producing quality DH work.
This is extremely appropriate to the current focus as food is something which brings people together. David B. Goldstein explores this notion, especially as it relates to early modern England in discussing eating (for better or worse) as a communal practice.[33] I propose that this communal interest in food, the product of recipes, can be extended to the products of recipe books. Data collection and analysis (for better or worse) should also be communal practice. In many ways, a DH project is its team. Each DH project will have different needs and requirements – sometimes the skills missing from a team can be self-taught, but often many realms of expertise will be necessary to bring a project to life. Additionally, projects tend to show bias towards the areas in which project teams are the most qualified and competent. Every team member brings something of themselves to a DH project – and more options on this potluck table can allow a project to take on avenues of inquiry previously closed to it. In this way, including more members in a DH team can be crucial to drive a project to new heights. I do not think it is a mistake that some of the largest DH projects are crowd sourced.[34] Crowd-sourced efforts can allow the most tedious part of a data gathering process to be spread amongst a vast user body. Because this model also values contribution over expertise, the success of these crowd-sourced projects proves by induction that Digital Humanities knowledge can be co-created by novice volunteers and students can easily claim a space within the DH sphere.
Collaboration with students, though, has some pitfalls. Student collaborators are not on equal footing with their project coordinators or principle investigators, often faculty members with control over the students’ grades, potential job-related opportunities (including letters of recommendation), etc. This precarious power dynamic must be acknowledged, and best practices for it (such as those outlined in the “Student Collaborators’ Bill of Rights”) should be deeply considered.[35] Ethical collaboration precedents have been set by this bill as well as its predecessor (the “Collaborators’ Bill of Rights”), and these general practices should be discussed and incorporated into classroom study where student labor becomes part of a DH project.[36]
Once harvested, data must be cleaned. Data “cleaning” is the process by which harvested data is made standard. I mentioned it (briefly) above in the context of transcriptional issues. The vast majority of data cleaning involves sifting through harvested data, by hand, and identifying issues like typos, unintentional spelling inconsistencies, or (as I did with this manuscript) transcription inconsistencies.[37] If using Google Sheets, the best way to clean data is to utilize the “Unique” function.[38] If using Microsoft Excel, students can experiment with the program’s embedded data validation tools to limit input into certain cells.[39] The more standardized a database’s fields can become, the easier it will be to spot patterns, draw correlations, and formulate conclusions about the information it contains. Data cleaning is a tedious – but vital – step in the database process, and it looks a little different for every DH project. Non-standard data is impossible to interpret because it obscures patterns. Pattern recognition is the chief aim of database work, and therefore raw data must always be thoroughly cleaned or processed to unlock its usefulness.
Data cleaning, it must be acknowledged, is another step of data translation. In some cases, it can be fairly straightforward – fixing typos or OCR errors. In others, it can grow complicated as translators face issues of original spelling variants and the like. The cleaning process is meant to be a clarifying one – removing obstacles which obscure the patterns a researcher is ultimately looking for. In every DH project, data cleaning rules should be recorded and standardized to maximize the potential for true patterns to emerge.
Step Four: Analyzing Data and Interpreting Findings
Once clean, the data can begin to yield conclusions. Much as Derek Pearsall argues scholars must approach manuscripts with “a degree of adventurousness” in order to learn from them, so too must scholars approach datasets.[40] One way to analyze data is to create charts and visualizations – both of which are supported robustly through Google Sheets and Excel. The process of creating visualizations forces a researcher to play with what they have – how many ways can the information before them be represented through graphic media? What new questions do these images propose? How might those questions be answered? Serendipity and curiosity are the best guides of the process at this phase – since no two datasets are completely alike, no one process can dictate how best to analyze the data.
Returning to the preliminary questions I used to frame my database, I started my analysis by thinking about ingredients. Using my database, I identified 337 discrete ingredients mentioned in the Baumfylde manuscript. About 80.12% of these ingredients were mentioned once and only once. Only 11.28% of ingredients were used twice, which left 8.6% of ingredients used more than twice. In terms of my initial questions regarding supplies that might be found readily on hand in an early modern kitchen, the numbers seem to indicate that there weren’t many standard ingredients households might expect to stock.
In dealing with the small percentage of items mentioned multiple times, I also had to deal with a certain amount of textual variance. The two most mentioned items (eggs and water) outstripped every other ingredient many fold. These two ingredients provide a useful case study in data cleaning: in its raw form, “eggs” was the most used ingredient (called for in 17 recipes) with “water” coming second (called for in 15 recipes). However, when I took into consideration textual variants of these items (“eggs”, also included “fresh laid eggs” and “egg whites;” “water” included “clean water,” “fayre water,” “fair water,” “spring water,” “hot water,” and “pump water”), the standardized count of “water” moved ahead as being an ingredient in 23 recipes. The standardized count of “eggs,” by comparison, was used in 19 recipes. For a breakdown of ingredients most frequently mentioned in the Baumfylde manuscript, see Figure C.

[Figure C]
Because I tracked the “where” elements outlined in my data structure above, I was also able to run some numbers around how many ingredients Baumfylde recipes generally require (or, as I will call it, “Ingredient Span”). The average recipe’s ingredient span was 7. Despite the fact that so many ingredients were called for infrequently, recipes were not generally limited to the “pantry staples” outlined in Figure C. To cook something, a chef using Baumfylde’s recipes would need to gather specialized ingredients (and likely only use them for one recipe). This isn’t terribly surprising due to the early modern period’s relative lack of preservation methods for fresh culinary products, but it does seem to indicate the labor-intensive nature of early modern cooking. Not only must a chef make the product in question, but acquire its ingredients temporally close to making said product (if not the day of). For depictions of ingredient span in Baumfylde recipes, see Figures D and E.
 [Figure D]

[Figure E]
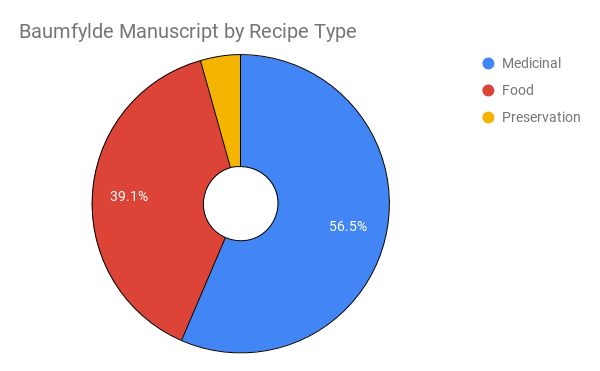
With the inclusion of my (admittedly very few) metadata fields, I was also able to divide the recipes into recipe “types.” Only 39.1% of the Baumfylde recipes create food items, while the majority (56.5%) are devoted to medicinal purposes. The small remaining sliver of 4.5% are recipes to preserve food in various ways. To see a visualization of this breakdown, consult Figure F.
[Figure F]
Pulling together my ingredient counts and my metadata analysis of recipe type, I can also begin to isolate what ingredients were used in various capacities. Of the 65 ingredients that were used more than once in the Baumfylde, 17 are used either exclusively in medicinal recipes or food recipes. Essentially, about half of the popular ingredients were exclusive in their use. See Figure G for a table of those exclusive ingredients.

[Figure G]
One thing to note about Figure G is that for the purposes of targeting unique ingredients, I did not standardize these ingredients. As such, “Spring Water” can be found in the list of food-specific ingredients and “Smythe’s Water” and “Fair Water” in medicinal-specific. Here, I believe nuance is necessary to provoke questions about the relative qualities of these various waters that would prompt Mary Baumfylde to specify water type in certain instances. This is one example of data granularity in action: while I conflated “water” in my analysis of most frequently used ingredients overall, had I done so on my master ingredient table I would not have been able to observe this correlation with recipe type. Well-cleaned and catalogued data should provide options and the capability to faithfully present many facets of itself.
Data analysis is perhaps the least clinical and most artful part of data-driven study. Every database will yield a different method for analysis, and perhaps even a different method for each researcher who deals with it. There is no one right way to analyze data so long as it is being authentically represented. Encourage students not to shy away from looking at outliers; is there something that stands out from the rest? Why? What makes it different? How can that lead to conclusions about the dataset as a whole? Often, outliers provoke the most interesting (and rich) questions about data, and lead researchers to further inquiry into the history surrounding their data object.
One example of an outlier that I encountered was the Baumfylde’s so-called “Miracle Cure.” While the average ingredient span required for a Baumfylde recipe is (as stated above) 7 items, the “Miracle Cure” requires a whopping 48, nearly three times as many as the next highest ingredient hog (“A Secret Quintessence” requiring 19 ingredients). It seems clear when looking at the title of this recipe why it might require so many things to craft – miracles, it seems, don’t come cheap. Indeed, the description of the effects of this medicine include everything from aiding in conception, to comforting the stomach, curing colds, helping toothaches, and keeping users in good general health. Since it is, essentially, an early modern catch-all medicine, there is some logic to its sheer massiveness: the more stuff in such a recipe, the higher the likelihood that its product will do literally anything for any given ailment. Baumfylde’s “Miracle Cure” is a perfect instance of an outlier provoking further study – what is this mysterious concoction? Did it truly help any of the ailments it proclaimed to, or was it snake oil? Data can highlight both answers and questions – often with nagging insistence that further work be done to answer these quandaries.
Step Five: Drawing Conclusions
While I have outlined conclusions gleaned from my analysis of the Baumfylde in the previous section, I think the more important conclusion is a call to action: what can you and your students find in this dataset that I didn’t? In the end, data analysis is all about a willingness to play with the data and discover new ways to look at it. Think of this process like a Rubik’s cube – twist it one way and there appears a mismatched hodge-podge of information. But a few turns to the left, and one can create order. My order is not definitive – there is no one way to craft that – but it is a starting place for understanding this manuscript. As many objects as there are in the vast fields of the humanities, there are that many potential datasets that can, perhaps, be combined and concatenated, understood as discrete parts, or pieces of a whole.
Appendix I: Teaching Activities
Teaching Activity 1: Identifying Categories
Have your students examine two or three recipes from the Baumfylde and identify a structure for the recipes at hand. What parts do these recipes have? Another way to look at this: if your students were to create an outline for these recipes as they might create for an academic paper, how would that outline be structured? What interesting details become evident when doing this? As an example, see Figure A.
Teaching Activity 2: Establishing Data Structures and Rules
Given their preliminary survey of the Baumfylde manuscript, have your students work in groups. Have each group devise a project which might be driven by collecting data in the Baumfylde. What kind of questions might they ask of this manuscript? What about it interests them? What do they feel is provocative within it in a way that might relate to something outside of the manuscript (history, the culinary arts, medicine, the state of women’s work, etc.)?
Once students have settled on the types of questions they might ask, have them create a structure for data categories which might answer these questions. Remind them that every project works under time, budget, and resource constraints – while they might one day seek to capture all the data in the manuscript, they can’t do it in a single pass.
Questions to consider in this process: Which data is more important, or relevant, to answering the questions they’ve asked? Have them create titles for data categories, and describe what those categories would entail. In essence – what “buckets” are they filling, and how will they fill those “buckets”? What fields will be included in their database, and what type of information will fill these fields? Remember to tie in the discussion, driven by Teaching Activity 1, surrounding data “rules.” How will transcriptions be standardized? How will “fringe cases” be handled? The clearer they are now, the easier their data will come together for interpretation later.
Teaching Activity 3: Data Harvesting
Have your students populate a database in Google Sheets or Excel. You can use my database, attached to this article, as a model if you wish. This is a time-consuming ordeal, and might be better done in “chunks” with certain sections of the manuscript assigned to certain groups of students, depending on what their various projects call for.
As an alternative, students may view my database and add to it – create additional categories, columns, or more granular pieces of information. Data harvesting is not generally about “reinventing the wheel,” but rather about building on the foundation left by the last researcher. If your students do add to my database, please reach out and let me know what they made. I would be interested to see what comes of it.
Teaching Activity 4: Playing the Part
Have your students consider Berg-Fulton et al.’s roles in relation to their groups; who is serving as the Humanist, Technologist, Data Steward, and Catalyst? How have the students observed their flow of communication through this project? In what ways have these four roles manifested in the students’ work together? Are they missing one or more areas of expertise to round out their team? If so, what roles could use bolstering by outside knowledge and where might they find that outside knowledge? If they could add someone to their team to make it function more strongly, what would that person be good at?
Teaching Activity 5: Data Cleaning
Have your students clean the data they compiled. In so doing, they will need to agree on rules for standardization. How will abbreviations be handled? How about non-standard spellings?
Students can use the “Unique” function of Google Sheets or Microsoft Excel to aid them in cleaning, or devise other ways to clean their data. Ideally, there should be at least two pairs of eyes on data before it moves to the analysis phase to ensure that minor errors such as typos are eliminated.
Teaching Activity 6: Analysis
Challenge your students to create as many different graphs/charts as they can from their database. Encourage them to experiment with: pie charts, line charts, bar charts, stacked bar charts, heat maps, and reference tables. Explore the different ways that these types of visualizations can display data; what does each chart show? How can they answer some of the questions the students had in their preliminary thinking about the Baumfylde? What other questions do these visualizations provoke?
Appendix
To view the data, click MS 7 Baumfylde data.
Danielle Rosvally, Ph.D., is a clinical assistant professor at the University at Buffalo department of theatre and dance. Her current research focuses on the value of Shakespeare’s work in America’s nineteenth century, and the creation of value as a performative act. In addition to her scholarly work, Danielle is a dramaturge, actor, and fight director.
Notes
[1] Christine L. Borgman, Scholarship in the Digital Age: Information, Infrastructure, and the Internet (Cambridge: MIT Press, 2007), 119–20.
[2] Folger Shakespeare Library, V.a.456.
[3] I’ve differentiated “Preserves” from “Food” based on immediacy of consumption (is the product meant to be eaten immediately, or meant to be stored for later?) as well as the titles of the receipts themselves (several receipts are titled “to preserve [food item]”). While only three receipts in the Baumfylde manuscript fall under the category of “Preservation” (by my count), I felt it was important to distinguish these due to my focus on the usage of certain ingredients – which will be discussed in greater detail below.
[4] This is not to be confused with the geometric process of “translation,” but the connotation is certainly apt. In geometry, “translation” describes a function that moves an object a certain distance on a plane without altering it. This process of shifting information from one place to another without changing it is, in fact, what I mean by “data translation.”
[5] Gilly Lehmann, “Reading Recipe Books and Culinary History: Opening a New Field,” in Reading & Writing Recipe Books 1550 – 1800, ed. Michelle DiMeo and Sara Pennell (Manchester: Manchester University Press, 2013), 93–113. It is also worth noting that Lehmann is currently undergoing a statistical analysis of all the medieval period English cookery collections extant in print, which will be included in her forthcoming book.
[6] Lehmann, 100.
[7] “Graphical User Interface” or “GUI,” is a term to describe any interface in which the user interacts with icons, windows, or other images rather than purely text-based interfaces like command line. Christopher Warren et al., “Six Degrees of Francis Bacon,” accessed July 1, 2019, https://sixdegreesoffrancisbacon.com; Laura Estill and Heidi Craig, “World Shakespeare Bibliography,” accessed July 7, 2019, https://www.worldshakesbib.org; Eric M. Johnson, “Open Source Shakespeare,” Open Source Shakespeare (blog), accessed April 21, 2019, https://www.opensourceshakespeare.org.
[8] While simple questions like “how often is ‘water’ mentioned in this book?” might be answered with a raw TEI-XML file, more complex questions like “how often is ‘water’ mentioned in this book in conjunction with its medicinal properties?” require database structures to answer.
[9] Yes, using the “PROPER” function.
[10] Susan J. Leonardi, “Recipes for Reading: Summer Pasta, Lobster à La Riseholme, and Key Lime Pie,” PMLA 104, no. 3 (May 1989): 340.
[11] Rebecca Laroche et al., “Becoming Visible: Recipes in the Making,” Early Modern Women 13, no. 1 (Fall 2018): 133–43; “The Recipes Project,” Blog and Collaborative Research Project, accessed July 1, 2018, https://recipes.hypotheses.org/.
[12] “Teaching Recipes,” The Recipes Project (blog), accessed July 8, 2019, https://recipes.hypotheses.org/thematic-series/teaching-recipes-a-september-series.
[13] This shift is well theorized by Kristine Kowalchuk, ed., Preserving on Paper: Seventeenth-Century Englishwomen’s Receipt Books (Toronto: University of Toronto Press, 2017).
[14] Elizabeth Spiller, Seventeenth-Century English Recipe Books: Cooking, Physic, and Chirurgery in the Works of W.M. and Queen Henrietta Maria, and of Mary Tillinghast, vol. 4, The Early Modern Englishwoman: A Facsimile Library of Essential Works, III (Burlington, VT: Ashgate, 2008), x.
[15] This shift is discussed and theorized in the context of the creation of a recipe book by Elaine Leong, Recipes and Everyday Knowledge: Medicine, Science, and the Household in Early Modern England (Chicago: University of Chicago Press, 2018).
[16] The discussion of recipe books as knowledge creation is well explicated in Wendy Wall, Recipes for Thought: Knowledge and Taste in the Early Modern English Kitchen (Philadelphia: University of Pennsylvania Press, 2016).
[17] Pamela H. Smith, “In the Workshop of History: Making, Writing, and Meaning,” West 86th: A Journal of Decorative Arts, Design History, and Material Culture 19, no. 1 (2012): 4–31.
[18] Elizabeth Spiller, “Printed Recipe Books in Medical, Political, and Scientific Contexts,” in The Oxford Handbook of Literature and the English Revolution, ed. Laura Lunger Knoppers (Oxford: Oxford University Press, 2012), 526.
[19] Users of Dromio, the Folger Shakespeare Library’s transcription tool, will likely see visual similarities between Figure A and the end result of tagging data in a transcription within Dromio. This is because the process is incredibly similar. Dromio is a GUI used to create back-end code which can, ultimately, be input into a database – precisely the process I am explicating in this paper.
[20] Alan Liu, “Chapter 50 N + 1: A Plea for Cross-Domain Data in the Digital Humanities,” in Debates in the Digital Humanities 2016 (Minneapolis: University of Minnesota Press, 2016), 561.
[21] It should be noted that Luna, the Folger Shakespeare Library’s digital image catalogue (https://luna.folger.edu), allows users to search terms in transcriptions of manuscripts. Thanks to the efforts of the Early Modern Recipes Online Collective (https://emroc.hypotheses.org) and the Folger’s docent volunteers, many of the Folger’s receipt books have been transcribed and those transcriptions are available on Luna. As such, this wider and deeper data pool is currently available for research use.
[22] Sylvie Neven and Sven Dupré, “The Colour ConText Database,” accessed July 2, 2019, https://arb.mpiwg-berlin.mpg.de.
[23] “ARTECHNE – Technique in the Arts, 1500-1950,” accessed July 1, 2019, https://artechne.wp.hum.uu.nl/artechne-database/.
[24] For a case study on adopting categories for a database, see Katherine Allen, “Categories in a Database of Eighteenth-Century Medical Recipes,” The Recipes Project (blog), October 13, 2015, https://recipes.hypotheses.org/6600.
[25] Certainly “rosewater” is different from “water,” a difference that a human eye will easily discern but a computer might not. This is part of what makes data mining the Baumfylde such a time-consuming manual task – humans interpret data in different ways than machines. It is easy for humans to understand distinctions (and the nuance of distinctions) between “water,” “clean water,” and “rosewater.” Computers, on the other hand, work with definite sets of rules and must be clearly instructed how cleanly matches might be made. In some regards, this makes the (albeit tedious) process of hand-mining data easier than the alternative of coding a machine to do it. Most humans understand why “rosewater” and “water” are different – that is intuitive. To a machine, however, intuition relies entirely on algorithms – which rely on human eyes to detect and code. This is a step which can be omitted with the present inquiry since it will be entirely driven by humans to populate the created database.
[26] It is possible to code a machine to accept “close enough” spellings as the same (“Hower,” and “Hour” for instance), but that is sophisticated enough that I will leave the topic for the reader to research on their own.
[27] The issue of data “cleanliness” is discussed in further depth by: Christof Schöch, “Big? Smart? Clean? Messy? Data in the Humanities,” Journal of the Digital Humanities 2, no. 3 (Summer 2013).
[28] The issue of transcription is one too large for this paper, but luckily one that other scholars have done vast work on particularly in regards to early modern recipe books. See especially: Laroche et al., “Becoming Visible: Recipes in the Making.”
[29] “Boolean” is a phrase used to denote values that can have one of two possible values: “true” or “false.”
[30] In Figure B, I have crafted a tree depicting a single possible track of data characterization for the Baumfylde. In a scenario where the Baumfylde was actually coded to this degree of specificity, every node would be broken into trees stretching to level 4. In this example, I have only expanded one such potential tree.
[Figure B]

[31] In some cases, it is possible to script data collection, but the Baumfylde (in its current manuscript-only form) does not readily present an opportunity for this. While Optical Character Recognition (OCR) software does exist, the type that would be useful in this case is expensive, faulty at best, and certainly not attuned to the early modern hands found in this manuscript. Additionally, even at its peak performance OCR makes mistakes, and OCR output (at least in its current phase of technological advancement) often needs a great deal of data cleaning to be rendered usable. OCR is a rapidly developing technology, and it is possible that this will soon change. One promising enterprise is the Transkribus platform which uses machine learning to train a computer on a set of handwriting in order to produce text from that handwriting. This model – dubbed “Handwritten Text Recognition” (HTR) – is not yet ready for recipe books as they are often written in different hands, sometimes using several hands on the same page. HTR requires a large sample of the same hand for optimal results, and would not yet be able to distinguish between different hands within the same small space in a document for the purposes of transcription. For more information about Transkribus, see: https://transkribus.eu.
[32] Tracey Berg-Fulton et al., “A Role-Based Model for Successful Collaboration in Digital Art History,” International Journal of Digital Art History 3 (2018), https://journals.ub.uni-heidelberg.de/index.php/dah/article/viewFile/34297/43447.
[33] David B. Goldstein, Eating and Ethics in Shakespeare’s England (Cambridge: Cambridge University Press, 2013).
[34] See, for instance, the crowd sourced transcription efforts: “Shakespeare’s World,” n.d., https://www.shakespearesworld.org/#/; “Smithsonian Digital Volunteers,” accessed July 15, 2019, https://transcription.si.edu; As well as the incredible social networking visualization tool: Warren et al., “Six Degrees of Francis Bacon.”
[35] Haley Di Pressi et al., “A Student Collaborators’ Bill of Rights,” June 8, 2015, https://humtech.ucla.edu/news/a-student-collaborators-bill-of-rights/.
[36] Tanya Clement et al., “Collaborators’ Bill of Rights,” in Off the Tracks: Laying New Lines for Digital Humanities Scholars, 2011, https://mcpress.media-commons.org/offthetracks/part-one-models-for-collaboration-career-paths-acquiring-institutional-support-and-transformation-in-the-field/a-collaboration/collaborators’-bill-of-rights/.
[37] Because transcription is such a large part of dealing with Baumfylde data, cleaning it can be made friendlier (and less time consuming) by making choices about how to transcribe at the time of harvesting. One way to solve potential transcription issues at the cleaning stage might be to create a field called “standardized spelling” and to populate it with a standard form of whatever field students are most interested in. In my database, this would have been “ingredients.” A standardized version of this field might tag both “fayre water” and “fair water” as “water.” Please note: I did not choose to include a standardized spelling field in my database, but rather dealt with textual variants in a way that I will discuss below.
[38] The “Unique” function will create a list of unique values in a range of cells. Going through this list, students can find places to standardize their data. Returning to a previous example for instance: perhaps “hower” and “hour” are the same unit of time measurement. The way data is cleaned will have a huge impact on its analysis, especially with a small dataset like that drawn from the Baumfylde manuscript. To read more about the “Unique” function in Google Sheets, check Google Docs support: https://support.google.com/docs
[39] Data validation, and other topics, can be best explored using Microsoft Office’s support website: https://support.office.com
[40] Derek Pearsall, “The Value/s of Manuscript Study: A Personal Retrospect,” Journal of the Early Book Society for the Study of Manuscripts and Print History 3, no. 2000 (2000): 176.